Two SaaS companies with $5M ARR can have valuations ranging from $22.5M to $37.5M. The difference? Revenue quality - not just revenue size. Buyers don’t only evaluate ARR; they assess how predictable, sustainable, and scalable your revenue is. This is measured through metrics like Net Revenue Retention (NRR), customer concentration, and the Revenue Quality Score (RQS).
Key takeaways:
- NRR above 120% can increase valuation multiples by 30-50%.
- Customer concentration risk (e.g., one client >20% ARR) can lower multiples by 1-2x.
- Revenue Quality Score (RQS) evaluates reliability (e.g., multi-year contracts) and control (e.g., self-serve models). A high RQS leads to higher multiples.
For example, two $5M ARR companies:
- Company A: High RQS, 120% NRR, no customer >10% ARR → 8x ARR, $40M valuation.
- Company B: Low RQS, <100% NRR, one customer at 40% ARR → 4x ARR, $20M valuation.
To increase your valuation:
- Shift to multi-year contracts.
- Improve NRR above 120%.
- Diversify your customer base to reduce concentration risk.
Buyers reward high-quality revenue with premium valuations. Focus on improving these metrics 18-24 months before selling to maximize your exit.
Revenue Quality Score Impact on SaaS Valuation Multiples
The State of SaaS in 2025: Multiples, Growth Strategies, Valuations, & Exit Planning
sbb-itb-9cd970b
Revenue Quality Tiers: How Buyers Assign Valuation Multiples
When it comes to valuing a business, the quality of its revenue plays a massive role. Buyers break revenue down into specific tiers, and these tiers directly influence valuation multiples.
The 3 Tiers of Revenue Quality
Buyers classify revenue into three primary tiers, each with its own valuation impact.
Tier 1: Locked Revenue (Multi-year Contracts)
This is the top tier and highly prized by buyers. It includes contracts lasting 12 months or more, where customers are locked in due to high switching costs and the essential nature of the product or service - think payroll systems or core business infrastructure [1].
Tier 2: Probable/Possible Revenue (Recurring Renewals)
This tier includes recurring revenue, such as month-to-month subscriptions or standard renewals with retention rates above 90% [1]. While still valuable, it’s less secure than Tier 1 because customers can cancel more easily. These products are often "nice-to-have" rather than absolutely essential, making them more vulnerable in tougher economic conditions.
Tier 3: Phantom Revenue (One-time Transactions)
At the bottom of the scale, this tier includes revenue from one-off transactions like consulting projects or custom development work. Since there’s no recurring component, this type of revenue is considered riskier and less predictable [1].
| Revenue Tier | Contract Type | Multiple Range | Characteristics |
|---|---|---|---|
| Tier 1 | Multi-year (12-24+ months) | 7x – 10x+ | Contractually locked, mission-critical, high switching costs |
| Tier 2 | Recurring (Month-to-month) | 4x – 6x | Strong renewal patterns (90%+), embedded in workflow |
| Tier 3 | One-time / Project-based | 1x – 3x | Consulting, custom dev, zero recurring component |
How Revenue Quality Affects Your Valuation
Knowing where your revenue stands on this scale is critical, as the tier directly impacts your valuation multiple. The table above highlights how each tier aligns with valuation ranges.
For example, while the average private SaaS company is expected to trade at around 4.5x ARR by 2026 [5], Tier 1 revenue can command multiples of 7x–10x or more [1][5]. Companies with strong Net Revenue Retention (NRR) - typically 120% or higher - can grow their existing customer base by 20% annually, which helps cut down on customer acquisition costs [7].
On the other hand, Tier 3 revenue, which relies on one-time transactions, is typically valued at just 1x–3x multiples. This is because it requires constant re-selling and offers unpredictable cash flow [1]. A good example is Predictology, a sports prediction SaaS with $445,000 ARR, which sold for $720,000 in 2024/2025. This translates to a 1.6x revenue multiple, as the buyer placed more value on its database assets than its recurring growth potential [8].
Public SaaS companies with NRR below 90% often trade at around 1.2x, while those with NRR above 120% can command multiples of 8x or higher [5]. Shifting customers from month-to-month subscriptions (Tier 2) to 12-month or longer contracts (Tier 1) can boost your valuation multiple by 1x–2x [1][3]. For many businesses, this could mean millions of dollars in added value without changing the underlying revenue base.
The Revenue Quality Score: What It Is and Why It Matters
The Revenue Quality Score (RQS) evaluates how predictable, sustainable, and valuable a company’s revenue stream is. While Annual Recurring Revenue (ARR) tells buyers how much revenue a business generates, RQS gives insight into how dependable that revenue will be after the business is acquired [2].
Here’s why it matters: Two companies with the same $5 million ARR can have valuations that differ by up to 3x, purely based on their revenue quality [2]. Sophisticated buyers prioritize this calculation when assessing a business. It’s a key factor that directly influences valuation multiples.
"The difference is revenue quality - a concept that captures how predictable, sustainable, and valuable a company's revenue stream actually is." - StockScreenr [2]
How to Calculate Your Revenue Quality Score
The RQS framework typically multiplies Reliability (how likely revenue is to continue) by Control (how much autonomy the business has over customer relationships). This calculation results in a score ranging from 1 to 16 [1].
- Reliability: Factors include contract length and Net Revenue Retention (NRR). A top score (4) means revenue is secured through long-term contracts (12+ months) and the product is mission-critical. A bottom score (1) indicates reliance on one-off projects with no recurring revenue [1].
- Control: This measures how much influence the business has over its customer relationships. A score of 4 reflects self-serve signups, product-led growth, and direct relationships. A score of 1 indicates heavy customer control, such as custom development [1].
Customer concentration acts as a multiplier. If a single customer accounts for more than 15-20% of ARR, buyers may reduce valuation multiples by 1-2x [5][6]. For example, a $5 million ARR business with 40% of its revenue tied to one client might only fetch 2x-3x ARR [5].
Net Revenue Retention (NRR) is the most heavily weighted factor because it demonstrates revenue growth without the need for new customer acquisition [7]. Businesses with NRR above 120% can secure 30-50% higher ARR multiples compared to those at 100% NRR, even with identical revenue [7]. A 10-point increase in NRR can boost an exit price by 20-30% [7].
For instance, in early 2026, Livmo advised a B2B SaaS company with $3.2 million ARR, 28% growth, and 24% margins. However, its NRR was only 94%, and one customer accounted for 22% of ARR, leading to offers of just 4.5x ARR. Meanwhile, a smaller SaaS company with $2.8 million ARR, weaker margins (9%), but better revenue quality - 118% NRR and no customer concentration above 5% - received offers exceeding 7x ARR [6].
"NRR is not just a measure of product quality. It is a valuation input that buyers price into their offers before the first call." - Khaled Azar, Livmo [7]
Once you’ve calculated your RQS, it directly impacts the ARR multiple buyers are willing to pay.
Revenue Quality Score and ARR Multiples
RQS determines which valuation tier your business falls into. While ARR measures revenue size, RQS quantifies its dependability and control. Below is a breakdown of how RQS translates to ARR multiples for a $5 million ARR company in the 2026 market:
| Revenue Quality Score | ARR Multiple Range | Implied Valuation | Characteristics |
|---|---|---|---|
| High (13-16) | 7x - 9x | $35M - $45M | NRR >120%, Concentration <10%, Growth >40% |
| Medium (9-12) | 4x - 5x | $20M - $25M | NRR 100-110%, Concentration <15%, Growth 15-30% |
| Low (5-8) | 1x - 2.5x | $5M - $12.5M | NRR <90%, Concentration >25%, High Churn |
In 2026, the average private SaaS company trades at approximately 4.5x ARR [5]. However, businesses with high RQS can achieve 7x-9x multiples, while those with low scores may only secure 1x-2.5x [5][6]. For a $5 million ARR company, this could mean the difference between a $5 million and a $45 million valuation - a $40 million swing based solely on revenue quality.
Public SaaS companies show an even greater range. Those with NRR below 90% often trade at around 1.2x revenue, while companies with NRR above 120% can command 8x or more [5]. The takeaway? Improving your Revenue Quality Score is the quickest way to achieve a premium valuation.
Buyer Underwriting: How Different Buyers Value the Same Business
When it comes to valuing a business, different buyers often see things through very different lenses. Two buyers might evaluate the same metrics - like ARR, growth, and margins - and still come up with valuations that differ by 1.5x to 3x [9]. Why? Because they focus on entirely different aspects of the business. Let’s break it down.
Strategic buyers view your company as a piece of their larger puzzle. They’re asking questions like, “Does this fit into our product roadmap? Can we cross-sell this to our existing customers? Will this give us an edge in the market?” Their focus is on synergies, how well the technology integrates, and whether it aligns with their long-term goals. Take Salesforce, for example. In 2025, it acquired Informatica for $8 billion, aiming to strengthen its data management capabilities and advance its strategic objectives [10].
Financial buyers, such as private equity firms, approach things differently. They see your business as a financial asset. Their focus is on metrics like IRR, predictable cash flow, and EBITDA margins. They often ask, “Can the current management team thrive without the founder?” For instance, in 2025, Thoma Bravo acquired Dayforce for $12.3 billion, emphasizing operational improvements and the company’s leadership in its category [10].
"I am working the hardest I've ever worked in 30 years. [PE firms] are not buying 'pretty good' companies. They want category leaders with clear paths to operational improvement."
- Orlando Bravo, founder of Thoma Bravo [10]
This difference in priorities explains the valuation gap. Strategic buyers often pay a premium - 1.5x to 3x more than financial buyers - because they see additional value in revenue and cost synergies. For example, a $5 million ARR company might attract a $10 million offer from a financial buyer, but a strategic buyer could go as high as $20 million.
What Each Type of Buyer Focuses On
Just like revenue quality impacts valuation, so do buyer-specific priorities.
Strategic buyers care most about how your product fits into their market strategy. They’re willing to pay extra for unique technology or intellectual property because acquiring it is often faster and cheaper than building it themselves. Growth rate is also a key factor - companies with 40% or higher growth rates can command much higher valuations [5]. Profitability isn’t always a dealbreaker for them if the technology is critical to their goals. They can also tolerate some customer concentration (up to 25% of ARR) if it aligns with their existing customer base.
Financial buyers, on the other hand, prioritize predictable cash flow and operational efficiency. Metrics like Net Revenue Retention (NRR) are crucial - a company with NRR above 120% can command ARR multiples that are 30–50% higher than one with NRR at 100% [7]. EBITDA margins also carry significant weight. If growth slows to below 15%, they’ll shift to valuing the business based on EBITDA multiples, typically in the 3–6x range [5]. Risks like customer concentration (over 15–20% of ARR from a single client) or heavy dependence on the owner can lead to steep valuation discounts - sometimes as much as 40% [5][6]. Interestingly, having multiple interested buyers - ideally a mix of strategic and financial - can often do more for your valuation than even an extra year of growth [5].
Comparing Strategic and Financial Buyers
The table below highlights how these two buyer types weigh key metrics differently:
| Metric | Strategic Buyer Weighting | Financial Buyer Weighting | Impact on Valuation |
|---|---|---|---|
| Primary Goal | Synergies & Roadmap Fit | IRR & Cash Flow | Strategic buyers pay for "future value." |
| Valuation Range | $2.0M – $6.0M | $1.0M – $4.0M | Approximately $1M – $2M difference. |
| Growth Rate | High | Medium | 40%+ growth can significantly boost multiples. |
| NRR | Medium | Very High | PE discounts heavily if NRR is below 100%. |
| EBITDA Margin | Low | High | PE may shift to 8–12x EBITDA if growth is below 15%. |
| Tech/IP Moat | Very High | Low | Strategic buyers assign a 1.5x to 3x premium for unique IP [9]. |
| Customer Concentration | Medium | Very High | Concentration above 20% can lead to a 1–2x discount [5][6]. |
In 2025, strategic buyers accounted for 42% of all SaaS transactions, while private equity-led deals hit a record high of 73 transactions in Q1 alone [10]. Both types of buyers are currently paying premiums for AI-native SaaS solutions. In fact, 80% of buyers report higher valuations for AI-driven companies, and 87% expect this trend to continue through 2027 [4]. However, the focus is on AI that genuinely impacts metrics like NRR - not just flashy product features.
"The multiple moves when AI shows up in your retention and expansion numbers - not when it shows up in your product roadmap slides."
- Khaled Azar, Livmo [4]
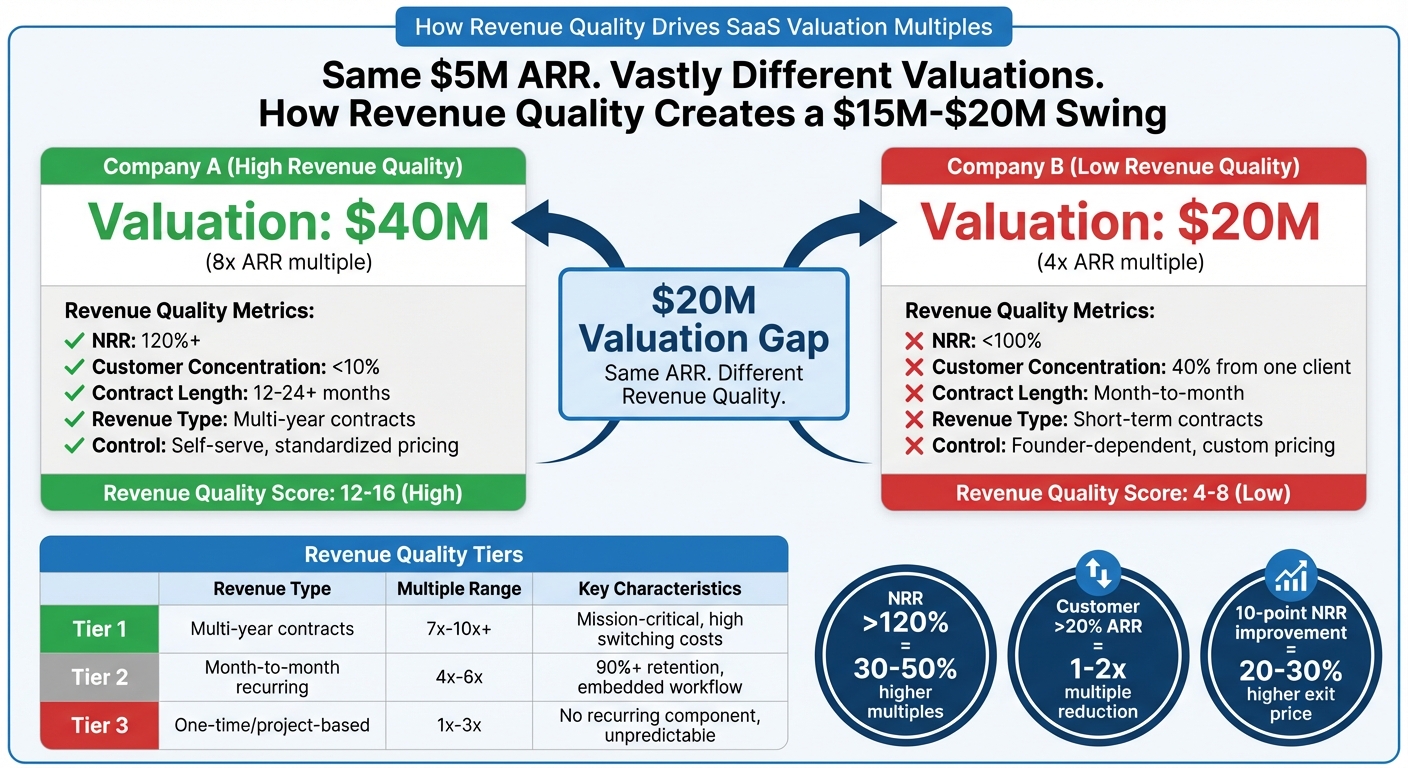
Case Study: Two $5M ARR Companies with Different Valuations
This case study dives deeper into how revenue quality can lead to vastly different valuations, even for companies with identical ARR in the same market. It highlights how buyers assess revenue durability and control during underwriting, creating substantial gaps in valuation.
Let’s compare two real companies, each generating $5 million in ARR. One was acquired for $40 million, while the other was valued at $20 million. The difference? Their Revenue Quality Score.
Company A: High Revenue Quality Score
Company A operates a workflow automation platform with an impressive 120% Net Revenue Retention (NRR). Customers not only stick around but increase their spending over time - without requiring additional sales effort. The company locks in predictable revenue through multi-year contracts (12–24 months), which buyers tend to prefer. On top of that, no single customer contributes more than 10% of total revenue, keeping concentration risk low. Their self-serve model and standardized pricing give them complete control over customer relationships.
Thanks to this strong revenue foundation, Company A achieved a Revenue Quality Score between 12 and 16. This earned them an 8x ARR multiple, resulting in a $40 million valuation. Buyers saw the business as a reliable growth engine that didn’t depend heavily on acquiring new customers [7].
Now, compare that to Company B, where a weaker revenue profile led to a significantly lower valuation.
Company B: Low Revenue Quality Score
Company B offers a project management tool, but its revenue structure is far less stable. Customers are on month-to-month contracts, and its NRR is below 100%, meaning it loses more revenue than it retains. Even worse, one customer accounts for 40% of its ARR, creating a major concentration risk. Most sales are personally managed by the founder, with pricing negotiated on a case-by-case basis, which limits consistency and control over revenue streams.
With a Revenue Quality Score between 4 and 8, Company B’s revenue profile was deemed "Risky" or even "Toxic" [1]. This resulted in a 4x ARR multiple and a $20 million valuation - half of what Company A achieved.
"A 10-point NRR improvement can translate to 20-30% more in your exit price. That math matters more than your growth rate."
- Khaled Azar, Founder, Livmo [7]
The $20 Million Gap: Why Revenue Quality Matters
The $20 million valuation difference between these companies boils down to how buyers viewed the stability and growth potential of their revenue streams. Company A’s revenue was seen as reliable and likely to grow, while Company B’s revenue came with significant risks - such as customer churn or loss of key accounts.
As we move toward 2026, buyers are increasingly paying premiums for predictable, durable revenue and heavily discounting businesses that carry uncertainty [11]. These examples clearly demonstrate that improving revenue quality can have a direct, meaningful impact on valuation during the underwriting process.
How to Improve Your Revenue Quality Score Before an Exit
If you're aiming to close the valuation gap highlighted in case studies, improving your Revenue Quality Score is a must. Buyers reward specific revenue characteristics, and focusing on these can significantly boost your business's appeal. Here are three critical areas to prioritize before your exit.
Move Customers to Multi-Year Contracts
Switching customers to multi-year contracts is one of the quickest ways to secure a valuation premium. Contracts lasting 24 months or more not only lock in revenue but also signal strong customer confidence, which can boost valuation multiples. This added certainty reduces discount rates in discounted cash flow (DCF) models, creating significant value for potential buyers [12].
To achieve this, formalize any informal agreements into multi-year contracts that include assignment clauses, ensuring revenue stability post-acquisition [13]. Concentrate on securing 24+ month commitments from new customers, especially those that extend beyond typical earnout periods. For existing customers, offer perks like discounted rates or upgraded features in exchange for longer-term commitments. Laying this groundwork well ahead of your planned exit gives buyers a clear picture of dependable future revenue.
Increase Net Revenue Retention Above 120%
Net Revenue Retention (NRR) is a key metric that directly impacts valuation. Companies with NRR above 120% often command 30% to 50% higher ARR multiples compared to those hovering at 100% NRR [7]. This metric is one of the first things buyers evaluate when making an offer.
"A 10-point NRR improvement can translate to 20-30% more in your exit price. That math matters more than your growth rate." - Khaled Azar, Founder, Livmo [7]
To boost NRR, consider adding usage-based pricing to your subscriptions. Introduce metrics like API calls, user seats, or data storage that scale naturally as your customers grow, creating a built-in path for revenue expansion without requiring extra sales effort. Structured Quarterly Business Reviews (QBRs) for your top 25% of accounts can also uncover upsell opportunities. Meanwhile, for customers showing signs of contraction, implement a downgrade plan 60 days before their renewal date. Even a modest 5% improvement in NRR can add 0.5x to 1x ARR to your valuation [7].
Reduce Customer Concentration Risk
High customer concentration is a red flag for buyers and can dramatically lower your valuation. For instance, a company with $5 million in ARR and 40% of its revenue tied to one client might only fetch 2x to 3x ARR, while a similar company with no single customer accounting for more than 10% could secure 5x to 6x ARR [5]. This difference can mean a swing of $10M–$15M in valuation.
Buyers typically apply steep discounts - ranging from 20% to 40% or a reduction of 1x to 2x in valuation multiples - when customer concentration risk is apparent [5][8]. The reasoning is simple: losing a major customer post-acquisition could severely impact the buyer's return on investment.
"If your top customer is 30% of revenue, your Rule of 40 score is irrelevant. That's a customer concentration problem that kills deals." - Khaled Azar [6]
To mitigate this risk, start diversifying your customer base at least two years before your planned exit. Aim to reduce your largest customer's share of revenue to below 15%, which could add 1x to 2x to your valuation multiple. Focus on acquiring new clients and leveraging upselling strategies within smaller accounts to create a more balanced revenue base. Additionally, ensure that your top 10 customers collectively contribute less than 50% of your total revenue to avoid red flags during due diligence.
Conclusion: Use Revenue Quality to Increase Your Valuation
The case studies above highlight a critical truth: the quality of your revenue has a direct and profound impact on your company's valuation.
While many founders focus their efforts on growing ARR, it’s the quality of that revenue - validated through buyer underwriting - that truly determines your exit value. Two companies with identical $5 million ARR can have drastically different outcomes. One might sell for 3x ARR ($15 million), while the other achieves 6x ARR ($30 million), all because of differences in revenue quality.
Small adjustments can lead to big valuation gains. For example, improving NRR from 105% to 115% could boost your multiple by 0.5x–1x, translating to an extra $2.5 million to $5 million for a $5 million ARR business. Similarly, reducing the revenue share of a key customer from 30% to below 15% could add another 1x–2x to your multiple, or $5 million to $10 million in value.
"The founder who understands what actually drives multiples walks into negotiations with leverage." - Khaled Azar, Livmo [5]
The Revenue Quality Score framework offers a practical way to evaluate and enhance your revenue streams. By multiplying Reliability (scored 1–4) by Control (scored 1–4), you can identify premium revenue sources and minimize riskier ones. Buyers reward these metrics with higher offers. Strategies like securing multi-year contracts, boosting NRR, and diversifying your customer base are all key steps to improving your score.
To maximize your valuation, start focusing on revenue quality well in advance - ideally 18 to 24 months before your planned exit. Founders who grasp the importance of buyer underwriting don’t just create stronger businesses; they also position themselves for far more lucrative exits.
The time to act is now. Begin improving your revenue quality today to set the stage for an exceptional outcome when it’s time to sell.
FAQs
How do I calculate my Revenue Quality Score (RQS)?
While there’s no universal formula for calculating a Revenue Quality Score (RQS), it involves evaluating a few important areas. Here’s what to focus on:
- Recurring vs. One-Time Revenue: Businesses with a higher proportion of recurring revenue tend to have stronger revenue quality. This type of income provides stability and predictability over time.
- Customer Concentration: A diverse customer base is key. Relying too heavily on a few customers can be risky, so spreading revenue across many clients is a sign of healthier revenue.
- Growth Sustainability: Look at metrics like customer retention and churn rates. High retention and low churn indicate that your growth is more likely to last.
To estimate your RQS, score each of these dimensions, assign appropriate weights based on their importance to your business, and combine them into an overall score. This approach gives you a clearer picture of your revenue’s health and reliability.
What NRR level do buyers expect for a premium multiple?
Buyers usually look for a Net Revenue Retention (NRR) above 120% when considering premium multiples. Why? Because businesses surpassing this benchmark often see 30–50% higher Annual Recurring Revenue (ARR) multiples, which can dramatically increase their valuation.
NRR is a critical metric that showcases a company's ability to retain and grow revenue from its existing customer base. For buyers, it’s a clear indicator of stability and growth potential, making it a key factor in determining a business's worth.
How low should customer concentration be before a sale?
Customer concentration is an important factor to address before a sale. Ideally, no single client should account for more than 10% of your revenue. High dependency on one customer increases risk, which can deter potential buyers or investors. By diversifying your client base, you make your business more stable and appealing.